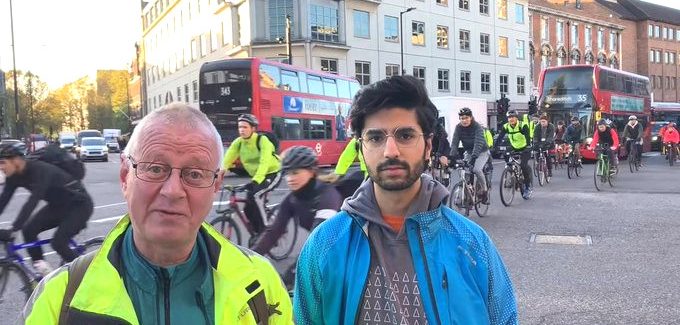
Post by Simon Saville, SC Co-ordinator (on left in photo at Borough junction)
New London Cycling Campaign mapping shows London’s most dangerous Junctions for cycling
London Cycling Campaign (LCC) has today released a new interactive map showing where London’s most dangerous junctions for cycling are. For the first time, LCC’s mapping covers all of London, and can be filtered to find the most dangerous junctions for pedestrians as well as those cycling – and by borough. The map uses the latest, recently released “Stats19” emergency services response data for 2018-2022.
In our borough, the roads between Elephant & Castle and London Bridge are a collision hotspot. We have been asking Southwark Council and TfL to work together to create safe routes for cyclists and pedestrians here. This has been a campaign over many years, with little effective action.
Just over a year ago, a child was seriously injured near Borough Station just cycling to school. We need TfL and Southwark Council to work together urgently to fix it.
The map shows that the main roads in Southwark are littered with dangerous junctions, where cycle users and pedestrians face serious risk every day. This affects Southwark’s residents and people from further afield as they travel through Southwark to the key Thames crossings for south east London.
And the two most dangerous junctions for pedestrians are Peckham High Street – Bellenden Road and Peckham Road – Lyndhurst Way.
Junctions and crossing points are where a significant proportion of serious and fatal collisions happen in London and in general. Safer junction design has long been understood to be one of the key methods of not only reducing road danger but also enabling more people to walk and cycle comfortably and safely.
LCC’s map has been a year in development to use an algorithm that treats nearby junctions as “clusters” (so larger gyratories or complex multi-junction systems show up), uses five years of emergency services data for “slight”, “serious” and “fatal” collisions weighted by DfT “value” factors, and weights newer collisions higher so junctions where traffic patterns have changed or improvements have been made are progressively downweighted, and factors in multi-victim collisions too.
For more information on the top 10 junctions, how the map has been created, as well as on what LCC views as vital to transform junctions for safety, see https://lcc.org.uk/news/londons-dangerous-junctions-2023/


Submit a Comment